运用HTML5画布实现的超棒javascript动画仪表板:gauge.js
日期:2014-05-17 浏览次数:21156 次
使用HTML5画布实现的超棒javascript动画仪表板:gauge.js
日期:2012-8-8 来源:GBin1.com

在线演示
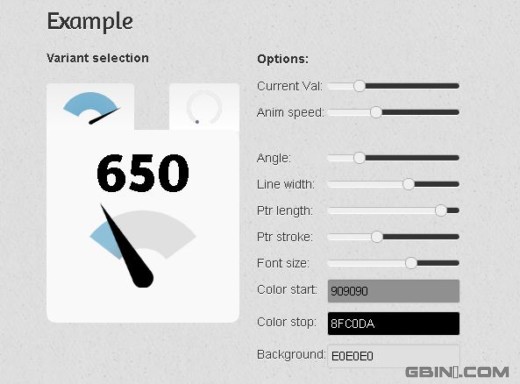
今天我们分享来自guage.js的超棒动画仪表板实现,这个类库使用html5画布来生成动态的自定义仪表板。不依赖于任何类库也不实用任何的CSS或者图片,完全使用画布生成。
拥有两套不同的UI,一个是仪表盘,一个类似原来我们介绍的jQuery knob界面。支持UI元素自定义你可以生成自己需要的颜色格式。
主要特性:
- 无图片,CSS
- 无类库依赖(支持jQuery,但是不是必须的)
- 高度可配置
- 分辨率独立
- 动画数值变化
- 支持主流浏览器
支持浏览器:
- Chrome
- Safari 3.2+
- Firefox 3.5+
- IE 9
- Opera 10.6+
- Mobile Safari (iOS 3.2+)
- Android 2.3+
如何使用
var opts = {
  lines: 12, // The number of lines to draw
  angle: 0.21, // The length of each line
  lineWidth: 0.44, // The line thickness
  pointer: {
    length: 0.9, // The radius of the inner circle
    strokeWidth: 0.108 // The rotation offset
  },
  colorStart: '#909090',   // Colors
  colorStop: '#8FC0DA',    // just experiment with them
  strokeColor: '#E0E0E0'   // to see which ones work best for you
};
var target = document.getElementById('foo'); // your canvas element
var gauge = new Gauge(target).setOptions(opts); // create sexy gauge!
gauge.maxValue = 3000; // set max gauge value
gauge.animationSpeed = 46; // set animation speed (32 is default value)
gauge.set(650); // set actual value
如果你使用jQuery,你可以使用如下插件代码:
$.fn.gauge = function(opts) {
  this.each(function() {
    var $this = $(this),
        data = $this.data();

    if (data.gauge) {
      data.gauge.stop();
      delete data.gauge;
    }
    if (opts !== false) {
      data.gauge = new Gauge(this).setOptions(opts);
    }
  });
  return this;
};
免责声明: 本文仅代表作者个人观点,与爱易网无关。其原创性以及文中陈述文字和内容未经本站证实,对本文以及其中全部或者部分内容、文字的真实性、完整性、及时性本站不作任何保证或承诺,请读者仅作参考,并请自行核实相关内容。
