Identify Java code consuming high CPU in Linux-linking JVM thread and Linux PID
日期:2014-05-16 浏览次数:21266 次
Identify Java code consuming high CPU in Linux--linking JVM thread and Linux PID
The original article is in : http://blogs.manageengine.com/appmanager/2011/02/09/identify-java-code-consuming-high-cpu-in-linux-linking-jvm-thread-and-linux-pid/
?
We can easily identify a problematic java code which leads to high CPU utilization in Linux. Let me explain the steps with the following example,
- ?package test;
- ?public class ThreadDumpTest {
- ???????? public void test(){
- ???????????????? for (int i = 0; i < 10 ; i++) {
- ???????????????????????? Thread th=new Thread(new TR(i));
- ???????????????????????? th.setName(“MyThread-”+(1000+i));
- ???????????????????????? th.start();
- ???????????????? }
- ???????? }
- ???????? public static void main(String[] args) {
- ???????????????? ThreadDumpTest t=new ThreadDumpTest();
- ???????????????? t.test();
- ???????? }
- ???????? private class TR implements Runnable{
- ???????????????? int ins=0;
- ???????????????? TR(int i){
- ???????????????????????? ins=i;
- ???????????????? }
- ???????????????? public void run(){
- ???????????????????????? while (true) {
- ???????????????????????????????? if(ins!=5) {
- ???????????????????????????????????????? try {
- ???????????????????????????????????????????????? Thread.sleep(10000);
- ???????????????????????????????????????? } catch (Exception e) {
- ???????????????????????????????????????????????? e.printStackTrace();
- ???????????????????????????????????????? }
- ???????????????????????????????? }
- ???????????????????????? }
- ???????????????? }
- ???????? }
- ?}
In the above example, all the threads are in while loop. Except ‘MyThread-1005 ‘ thread, all other threads will sleep 10 secs inside the loop. The ‘MyThread-1005 ‘ thread will not enter sleep part, so it will run in while loop without sleep. Due to while loop, the ‘MyThread-1005 ‘ thread will leads to high CPU utilization.
How to identify ?
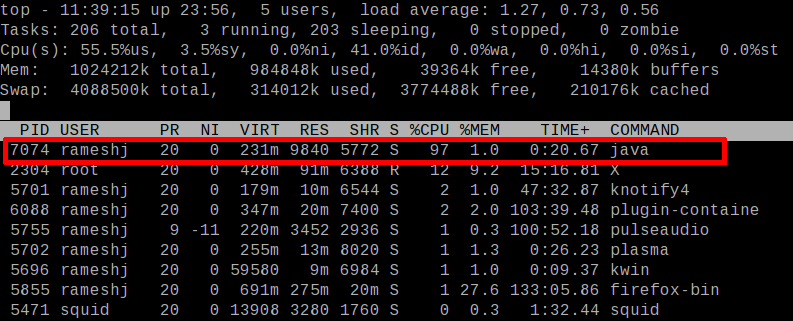
Step 1 :
Execute ‘top
‘ command on the console. You can see the ‘java’ command with PID 7074 utilized 97%
of CPU.
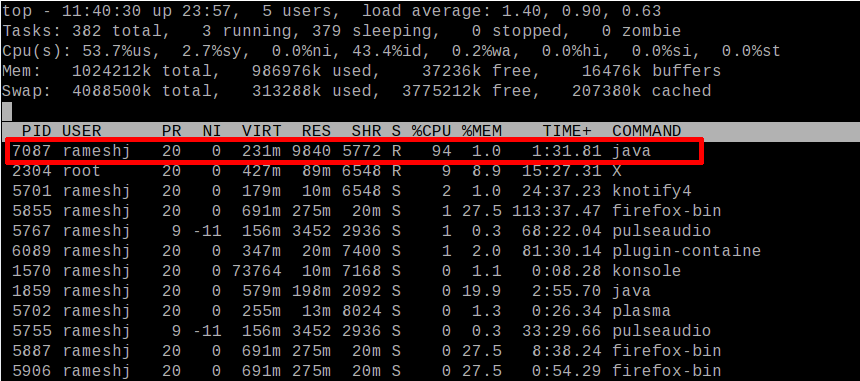
Step 2 :
The top command displays the process list like the above image. Press ‘Shift + h
‘ and wait few secs. You can see ‘Show threads on
‘
message in the top console. Now, you can see thread level details like
CPU/Memory utilization. You can see a ‘java’ command thread with PID
7087 utilized 94%
of CPU.
Step 3:
The identified problematic thread PID ( 7087 ) is in decimal format. Convert it into hexadecimal format
. The respective hexadecimal for 7087 is 1BAF. And convert it into lowercase (1baf ).
Step 4:
?
Take thread dump and search the converted hexadecimal PID ( 1baf ) in the thread dump. You can find the hex PID as ‘
免责声明: 本文仅代表作者个人观点,与爱易网无关。其原创性以及文中陈述文字和内容未经本站证实,对本文以及其中全部或者部分内容、文字的真实性、完整性、及时性本站不作任何保证或承诺,请读者仅作参考,并请自行核实相关内容。