php xdebug配置有关问题,抓狂!
日期:2014-05-17 浏览次数:20895 次
php xdebug配置问题,抓狂!!
我的环境是:Windows XP下的Apache 2.2.9 + PHP 5.2.6 + MySQL 5.1.28
打开phpinfo.php没有显示配置成功的信息

我以为是xdebug的版本问题,于是下了php_xdebug-2.1.1-5.3-vc6.dll,php_xdebug-2.0.2-5.2.5.dll,php_xdebug-2.1.1-5.3-vc6-nts.dll,php_xdebug-2.1.1-5.2-vc6-nts.dll这4个版本,又重复试验过,有重启apache服务器
路径:
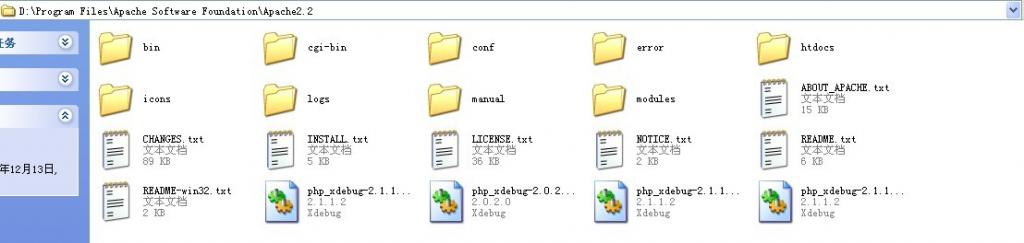
php.ini配置如下:
搞了很久也弄不好~抓狂死了!!大家看看是什么问题!
------解决方案--------------------
贴上我的配置:
zend_extension=D:\php5\ext\php_xdebug-2.1.1-5.3-vc9.dll
[Xdebug]
xdebug.remote_enable=on
xdebug.remote_handler=dbgp
xdebug.remote_host=localhost
xdebug.remote_port=9000
xdebug.auto_trace=on
xdebug.profiler_enable=on
xdebug.collect_return=on
xdebug.show_local_vars=on
xdebug.max_nesting_level=50
xdebug.var_display_max_depth=6
xdebug.dump_once=on
xdebug.dump_globals=on
xdebug.dump_undefined=on
xdebug.dmp.REQUEST=*
xdebug.trace_output_dir=D:\debug
xdebug.profiler_output_dir=D:\debug
------解决方案--------------------
查看一下php日志,看看有没有出错信息
extension_dir="D:\php5\ext"
extension=xdebug.dll
加上试试
------解决方案--------------------
xdebug.default_enable = On
我的环境是:Windows XP下的Apache 2.2.9 + PHP 5.2.6 + MySQL 5.1.28
打开phpinfo.php没有显示配置成功的信息
我以为是xdebug的版本问题,于是下了php_xdebug-2.1.1-5.3-vc6.dll,php_xdebug-2.0.2-5.2.5.dll,php_xdebug-2.1.1-5.3-vc6-nts.dll,php_xdebug-2.1.1-5.2-vc6-nts.dll这4个版本,又重复试验过,有重启apache服务器
路径:
php.ini配置如下:
[Zend]

;zend_extension_manager.optimizer_ts="D:\Program Files\Zend\ZendOptimizer-3.2.6\lib\Optimizer-3.2.6"

;zend_extension_ts="D:\Program Files\Zend\ZendOptimizer-3.2.6\lib\ZendExtensionManager.dll"


zend_extension="D:\Program Files\Apache Software Foundation\Apache2.2\php_xdebug-2.1.1-5.3-vc6-nts.dll"


[Xdebug]


;是否开启自动跟踪


xdebug.auto_trace = On


;是否开启异常跟踪


xdebug.show_exception_trace = On


;是否开启远程调试自动启动


xdebug.remote_autostart = On


;是否开启远程调试


xdebug.remote_enable = On


;允许调试的客户端IP


xdebug.remote_host=localhost


;远程调试的端口(默认9000)


xdebug.remote_port=9000


;调试插件dbgp


xdebug.remote_handler=dbgp


;是否收集变量


xdebug.collect_vars = On


;是否收集返回值


xdebug.collect_return = On


;是否收集参数


xdebug.collect_params = On


;跟踪输出路径


xdebug.trace_output_dir="D:\Program Files\Apache Software Foundation\Apache2.2\xdebug"


;是否开启调试内容


xdebug.profiler_enable=On


;调试输出路径


xdebug.profiler_output_dir="D:\Program Files\Apache Software Foundation\Apache2.2\xdebug"
搞了很久也弄不好~抓狂死了!!大家看看是什么问题!
------解决方案--------------------
贴上我的配置:
zend_extension=D:\php5\ext\php_xdebug-2.1.1-5.3-vc9.dll
[Xdebug]
xdebug.remote_enable=on
xdebug.remote_handler=dbgp
xdebug.remote_host=localhost
xdebug.remote_port=9000
xdebug.auto_trace=on
xdebug.profiler_enable=on
xdebug.collect_return=on
xdebug.show_local_vars=on
xdebug.max_nesting_level=50
xdebug.var_display_max_depth=6
xdebug.dump_once=on
xdebug.dump_globals=on
xdebug.dump_undefined=on
xdebug.dmp.REQUEST=*
xdebug.trace_output_dir=D:\debug
xdebug.profiler_output_dir=D:\debug
------解决方案--------------------
查看一下php日志,看看有没有出错信息
extension_dir="D:\php5\ext"
extension=xdebug.dll
加上试试
------解决方案--------------------
xdebug.default_enable = On
免责声明: 本文仅代表作者个人观点,与爱易网无关。其原创性以及文中陈述文字和内容未经本站证实,对本文以及其中全部或者部分内容、文字的真实性、完整性、及时性本站不作任何保证或承诺,请读者仅作参考,并请自行核实相关内容。